Usage Dashboard
The Usage Dashboard of a host shows what each block of an LXD App Server consumes: the tunnel, the proxy, LXD and its guests, PostgreSQL, and the host itself. Each block carries a status and the reasons for it. The dashboard reads the last usage snapshot of the host; it measures nothing itself.
Which hosts have one
A host has a Usage Dashboard when it is an LXD App Server: its LXD instances allocator, Default Reverse Proxy and Default PostgreSQL Cluster are all set. These are the three fields the Install LXD App Server wizard fills.
Opening the dashboard
Click Usage in the button box of the Host form. The button shows only on a host that has a Usage Dashboard.

The dashboard opens full screen, without Odoo's menu bar. Its title is
<host> · Usage Dashboard. The browser's back button returns to the Host form. A reload or a
copied link reopens the same dashboard.
To open it in a new tab instead, check Open in a new tab in the settings (below).
The dashboard is reserved for Muppy infrastructure users.
What the page shows
From top to bottom:
- The title band: the host, the age of its snapshot, the theme selector and Refresh. The band turns purple, labelled Outdated, when the snapshot is older than Outdated after.
- The diagram: the tunnel, the proxy, LXD and its guests, and PostgreSQL, inside the frame of the host, each with its status. A Traefik server or a PostgreSQL cluster that runs on another host sits outside the frame.
- One panel per block: Tunnel, Proxy, App Servers and other LXD guests, PostgreSQL, and Host with its CPU, memory and disk gauges. On other hosts lists the blocks outside the frame.
- Two collapsible sections: How each status is decided and How each figure is measured.
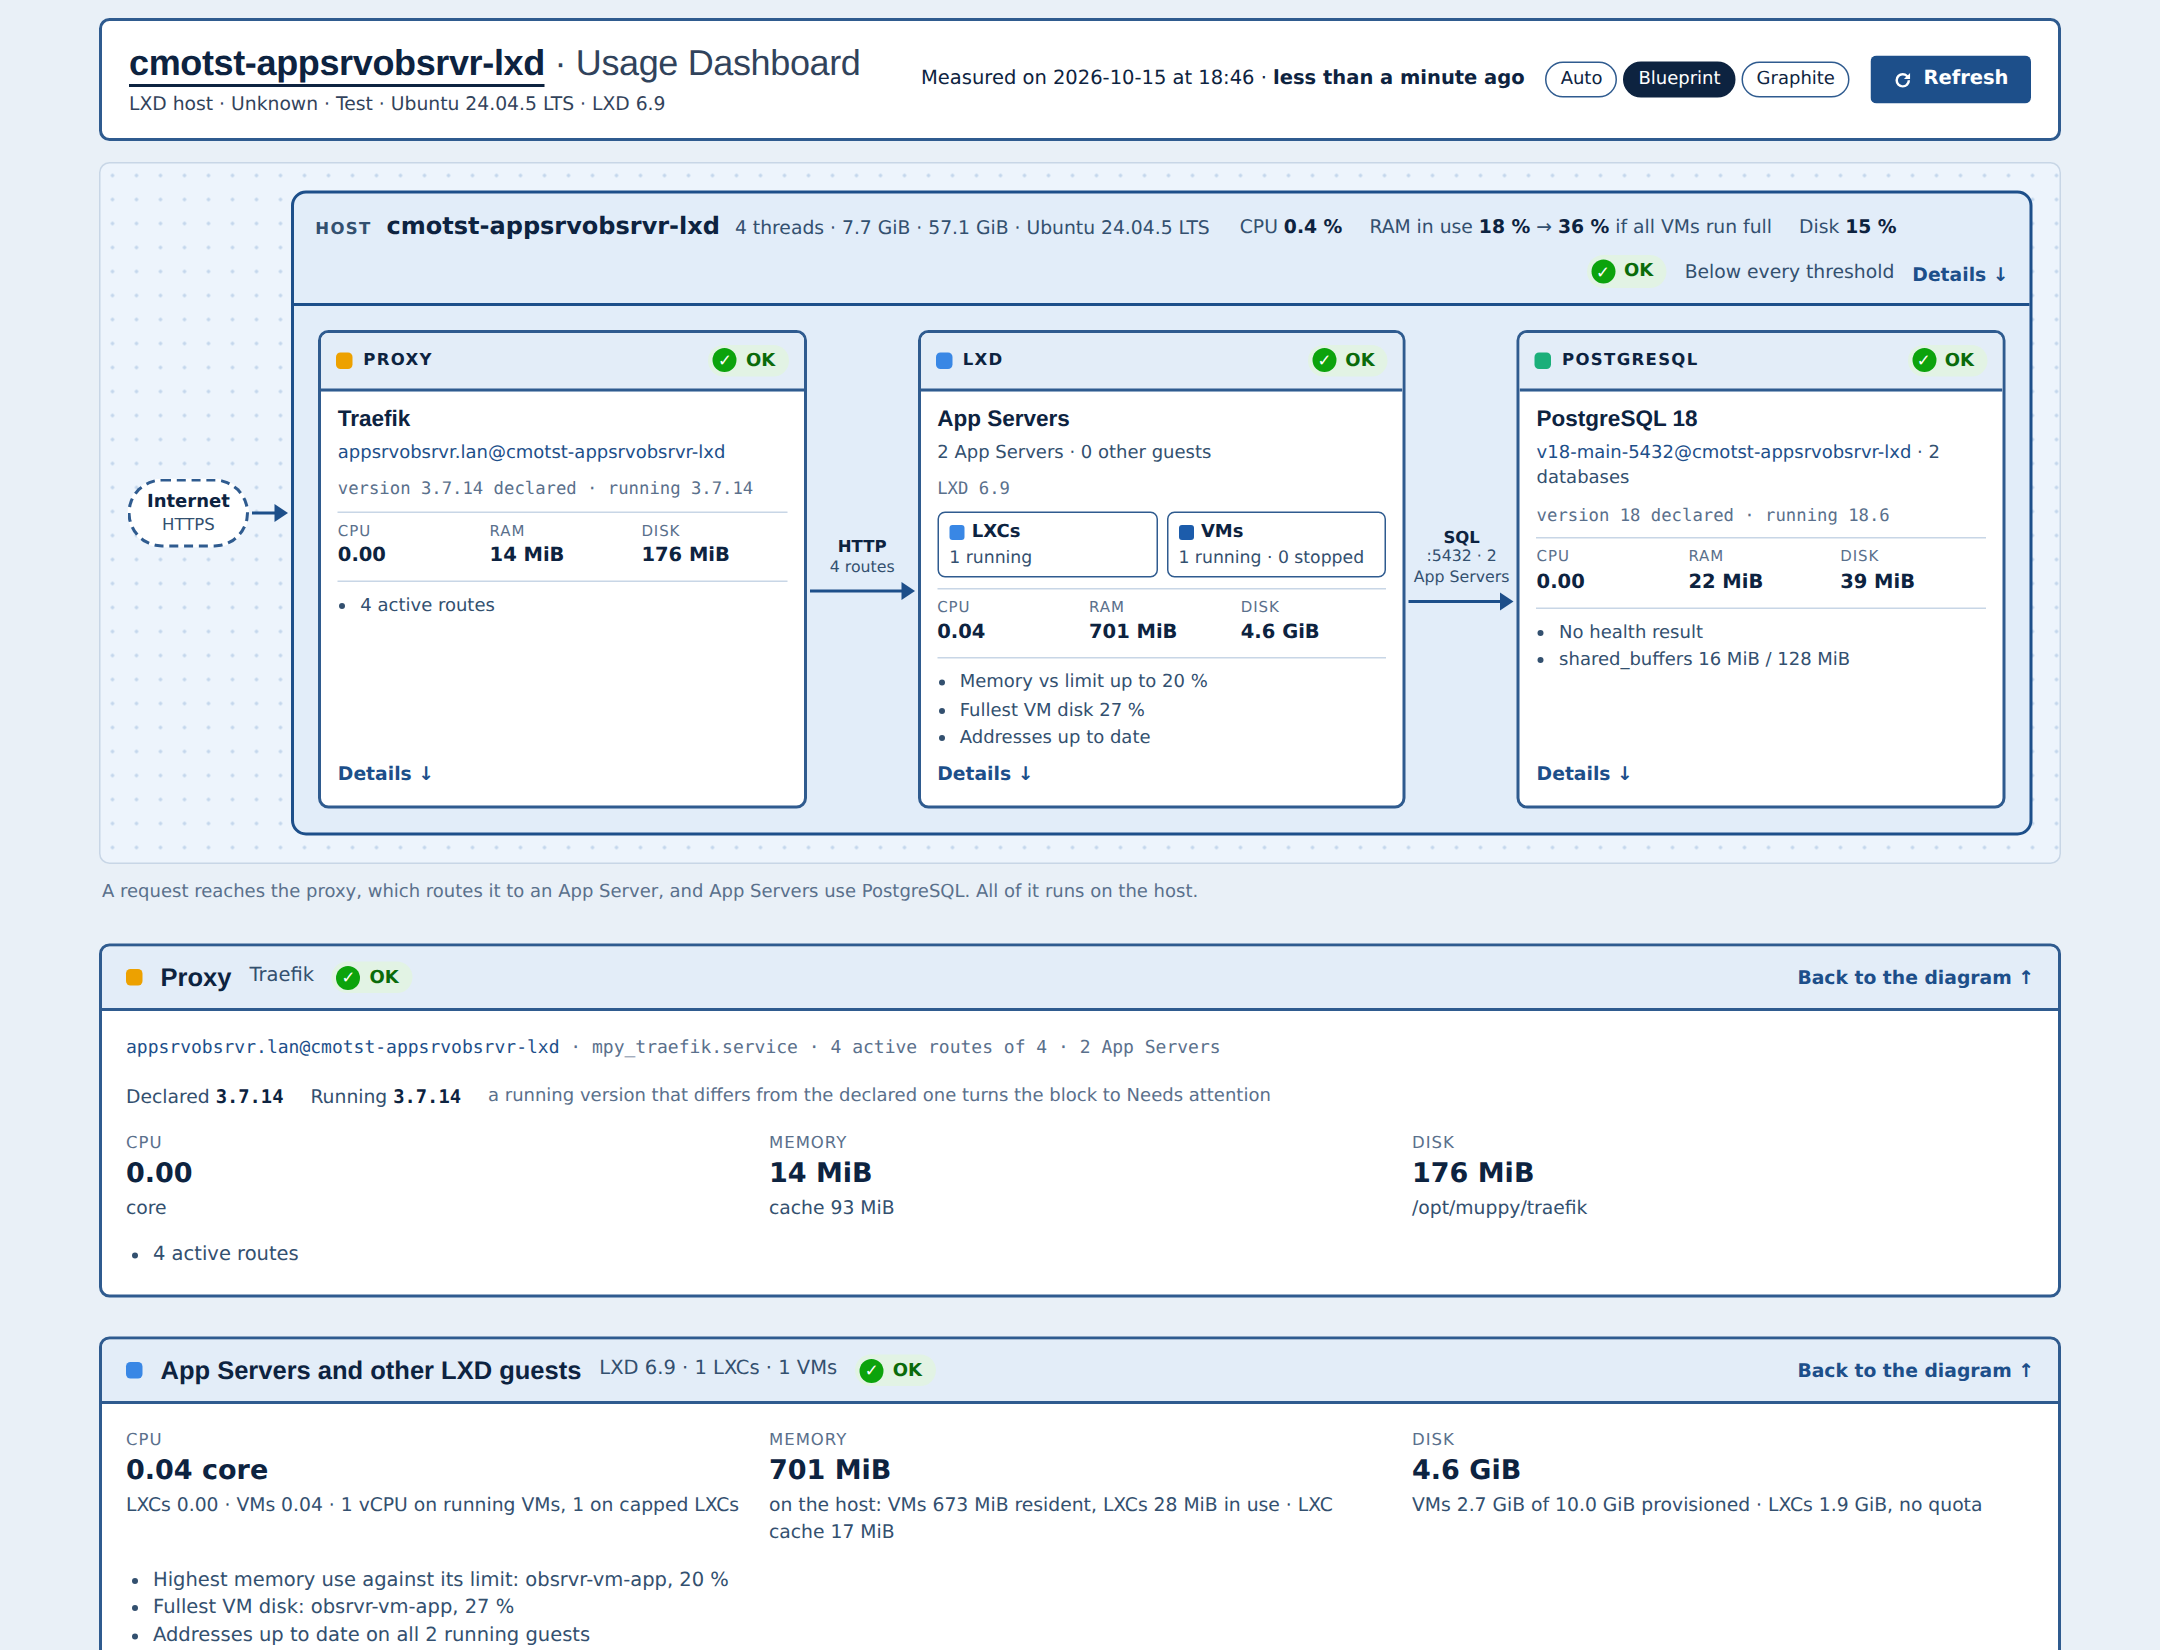
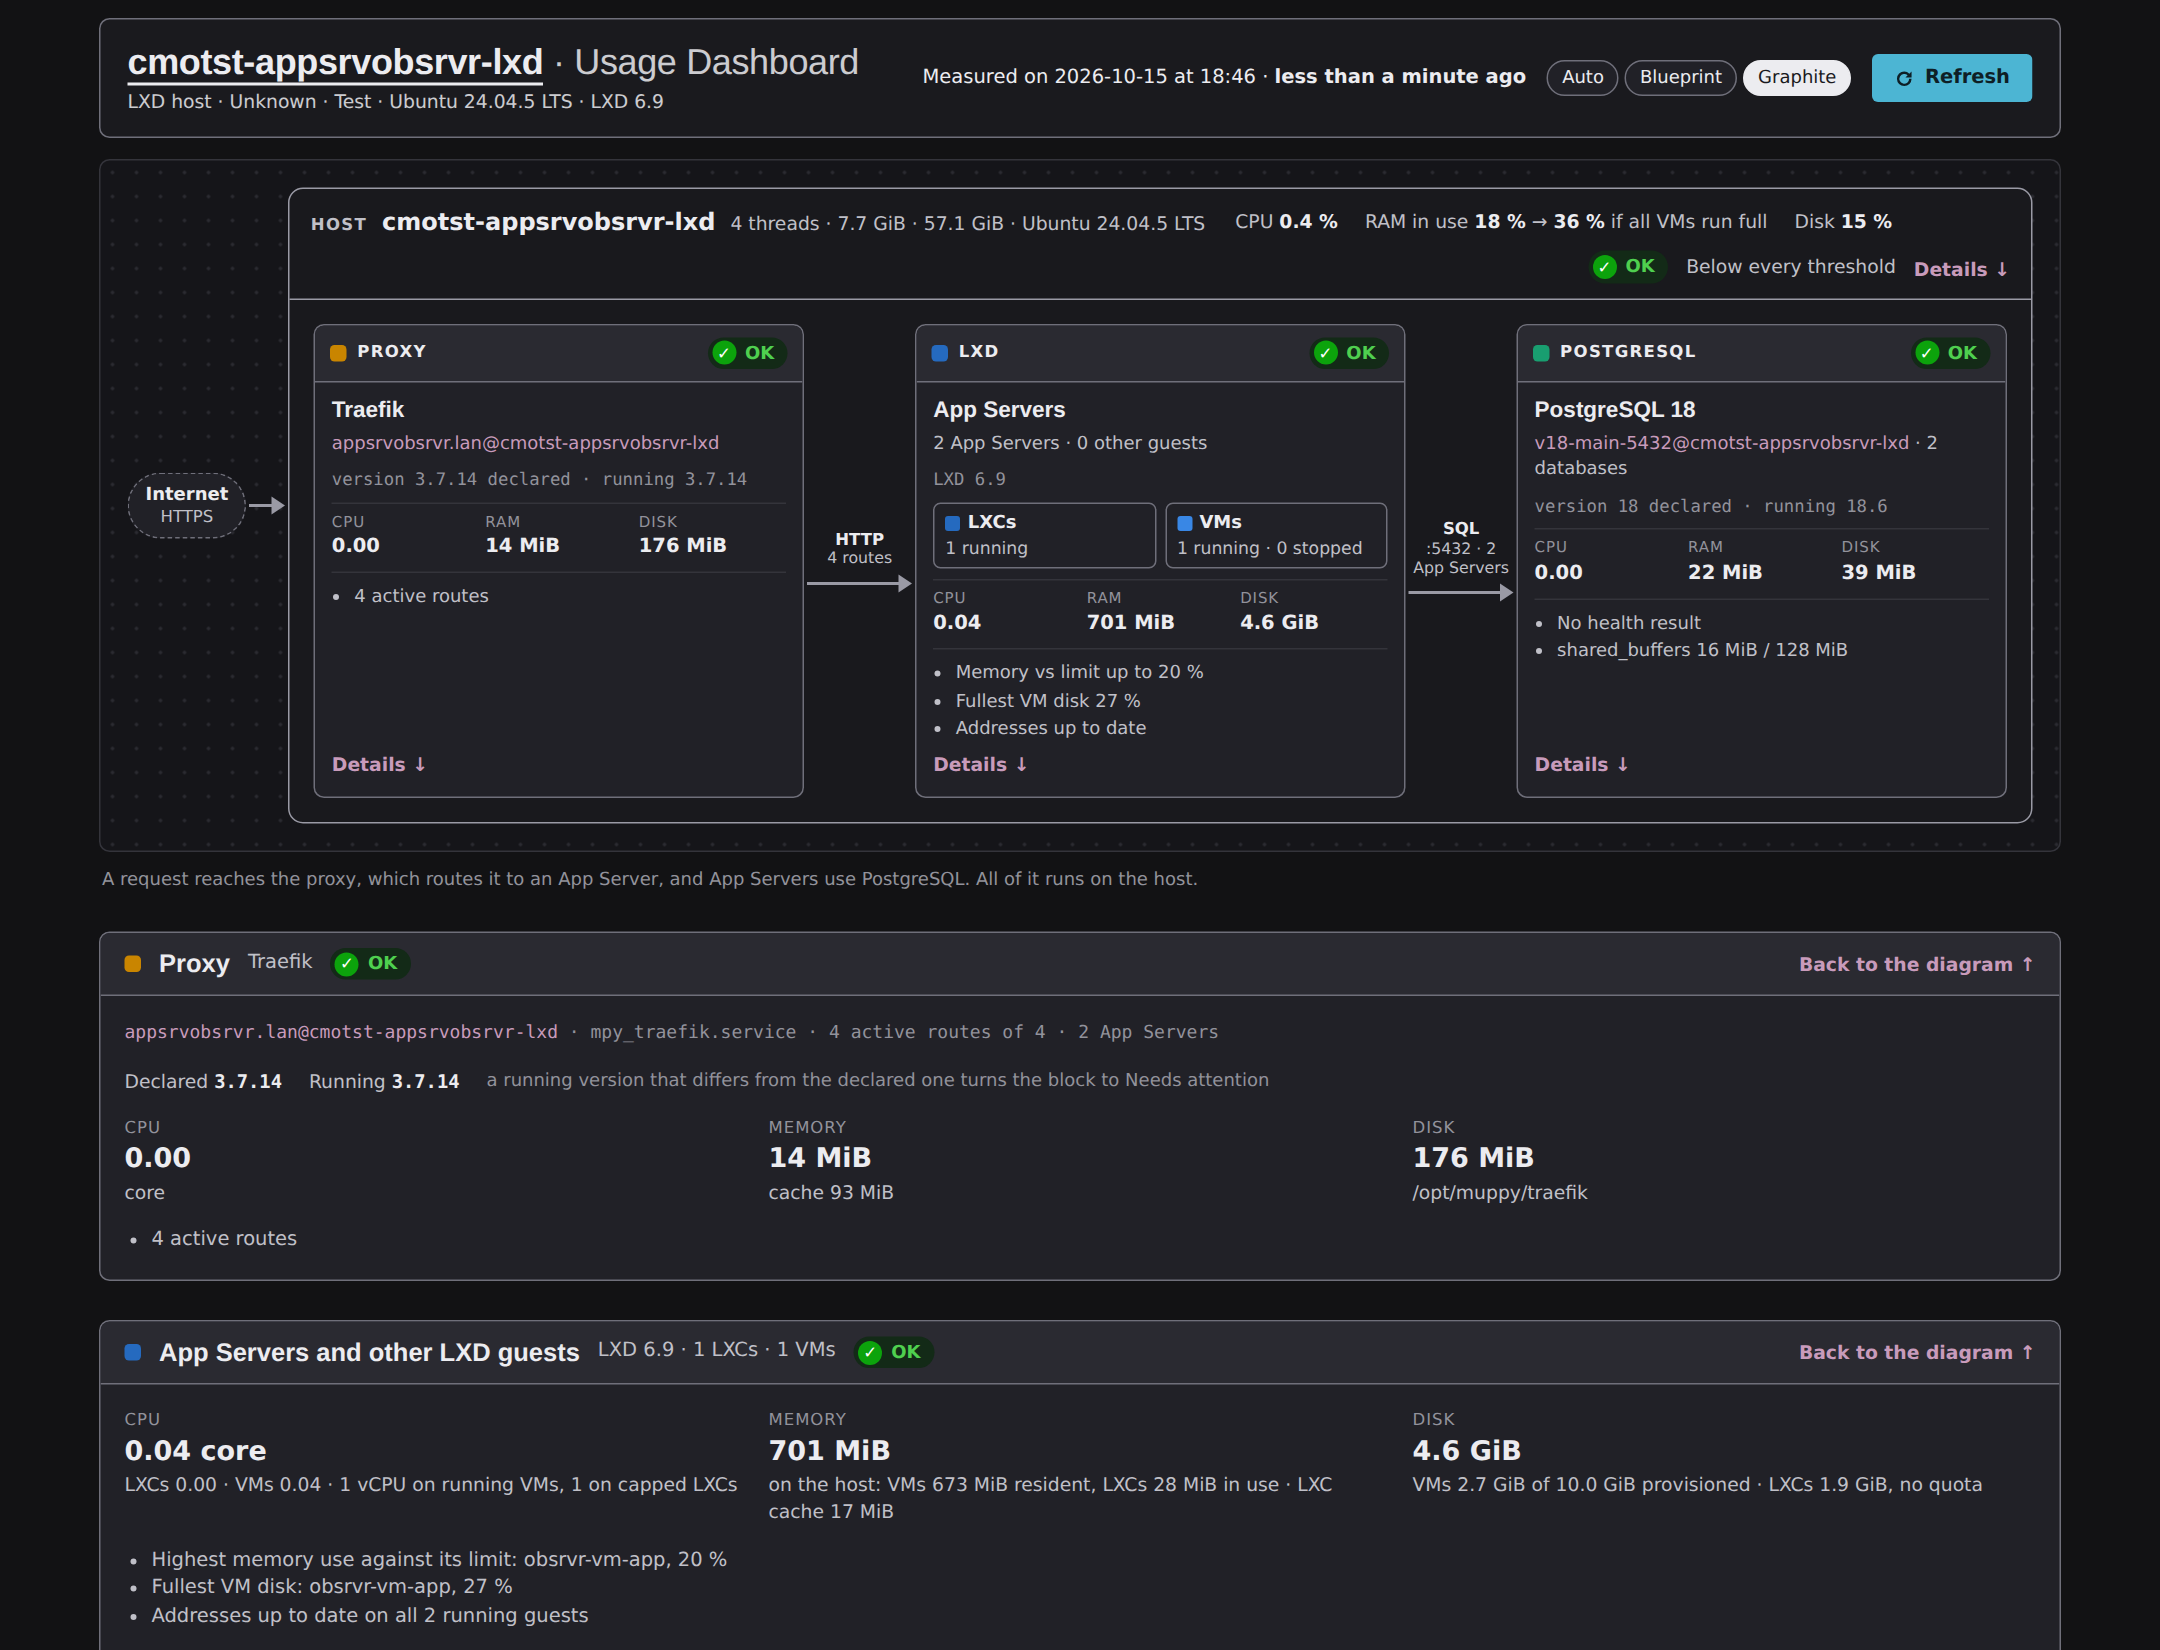
The theme selector offers Auto, which follows the browser, Blueprint (light) and Graphite (dark). The browser remembers the choice.
The page changes nothing. Its links open the form of the host, of a Traefik server or of a PostgreSQL cluster. A block on another host links to the Usage Dashboard of that host, or to its form when it has none.
The usage snapshot
The snapshot is the Fact HOST_USAGE. A second Fact, HOST_USAGE_ATTEMPT, records every
attempt, failed ones included. A failed attempt keeps the previous snapshot.
Five gestures take a snapshot:
- Refresh on the Usage Dashboard;
- opening the Usage Dashboard when its snapshot is outdated, or when the host has none, unless a snapshot was tried within Outdated after: a host that cannot be reached is not tried again at each opening;
- Update Facts on the Host form;
- the scheduled action Muppy: Collect all Facts for all Hosts, once a day when it is active;
- a Task Run of
collect_host_usage. Check force_scan to photograph a host that has no Usage Dashboard.
The snapshot runs in the background, in a job of its own: follow it in the Qs menu. It samples the CPU of the host for ten seconds, so it takes a little longer than that.
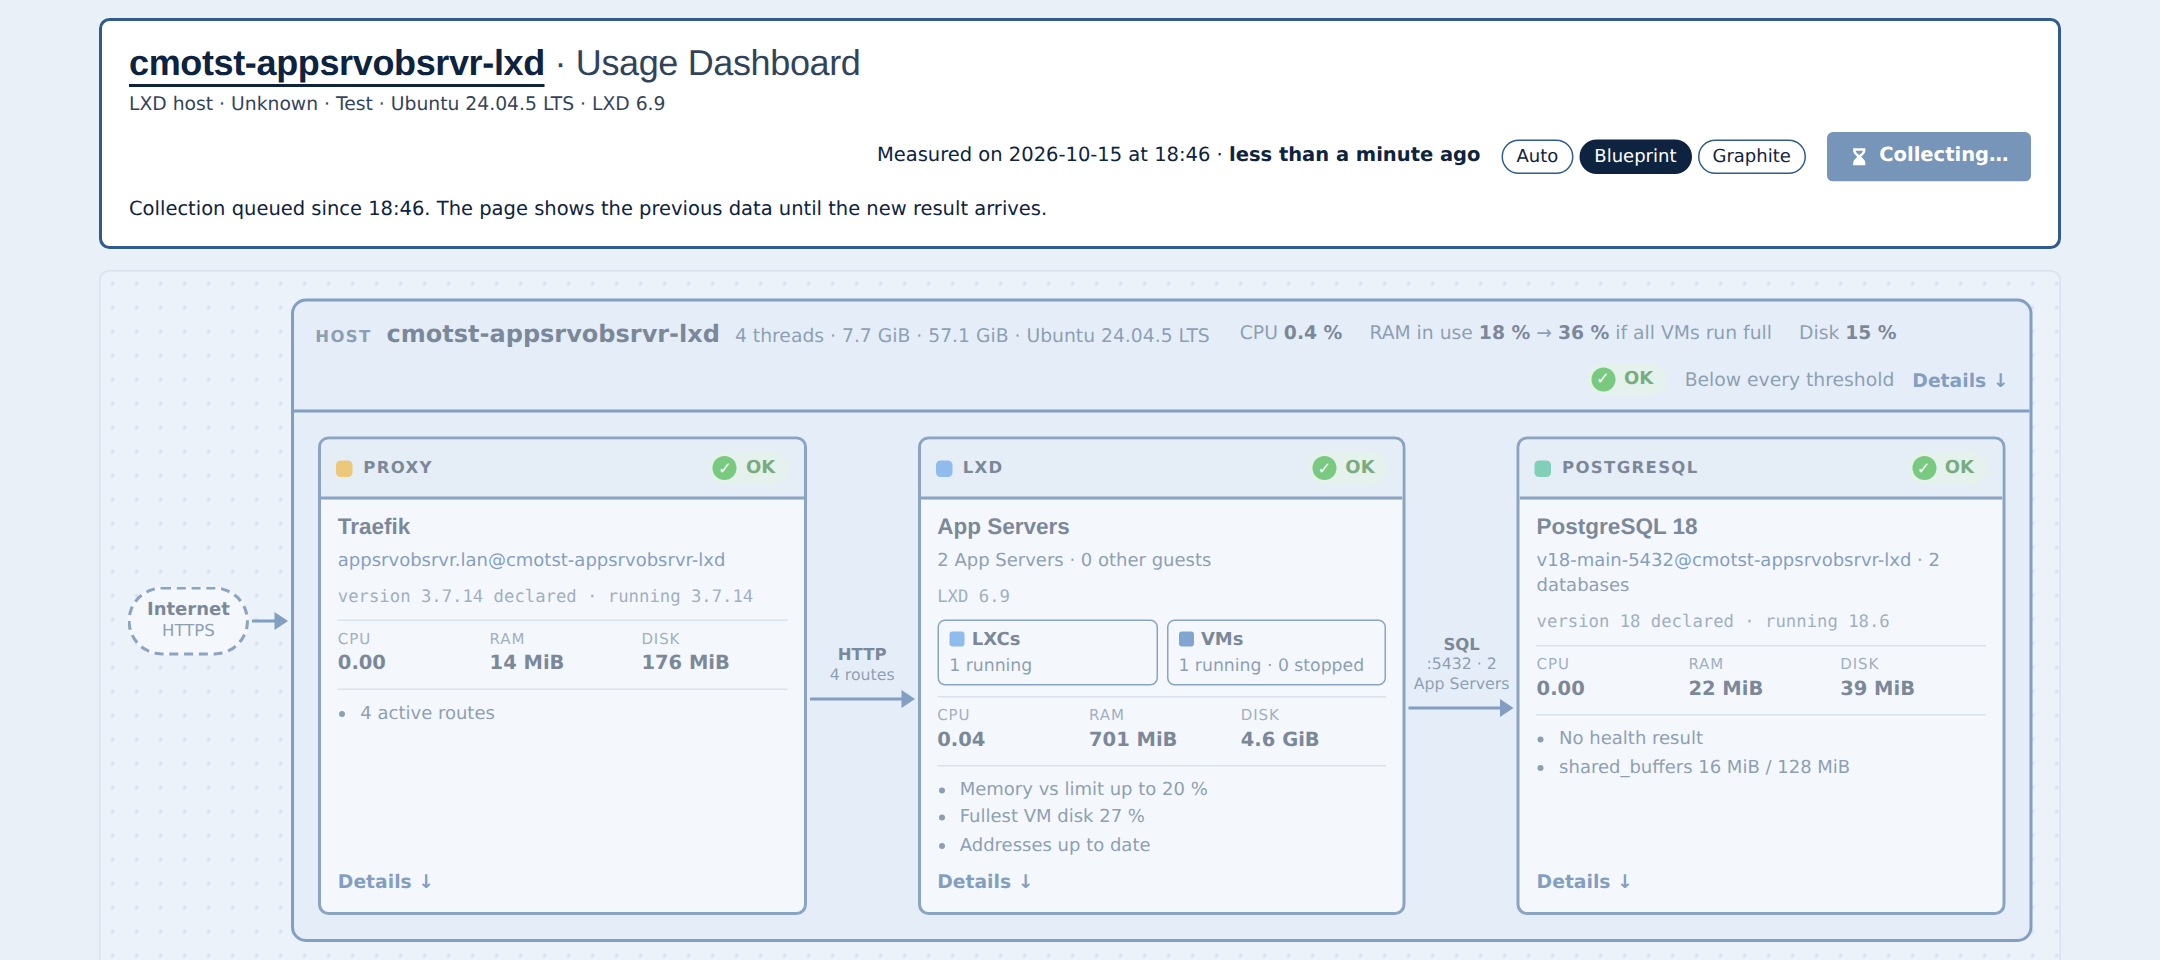
The page follows the snapshot that Refresh or its opening takes:
- The button shows an hourglass and reads Collecting…. The page greys the previous figures.
- The new snapshot replaces them when it arrives, without reloading the page.
- While a snapshot of the host is queued or running, Refresh follows that one and queues no other.
- A failed attempt shows its error in the title band, above the previous snapshot.
- After five minutes without a result, the page stops waiting and offers Open the IMQ message.
See Fact Definitions › Collecting all facts for how the collection of all facts runs it.
Statuses
Each block has one of four statuses:
| Status | Meaning |
|---|---|
| OK | Below every threshold, nothing to report. |
| Needs attention | Something to look at; the block still works. |
| Critical | The block does not work, or is about to stop. |
| Unknown | The last snapshot could not read the block, or the state of its unit. |
The rules, block by block:
| Block | Needs attention | Critical |
|---|---|---|
| Tunnel | Its unit runs on the host but is not imported in Muppy. | Its unit is down: no traffic reaches the host. |
| Proxy | An active route leads to a stopped guest whose App Server is neither a Development nor a Demonstration one; or the Traefik version running differs from the one Muppy declares. | Its unit is down. |
| LXD | A running guest uses more memory than the warning threshold of its limit, cache excluded; a VM disk is fuller than the warning threshold; or a running guest's address in Muppy is not one LXD gives it. | A guest or a VM disk is above the critical threshold. |
| PostgreSQL | The cluster's health check fails, or the major version running differs from the one Muppy declares. | The cluster is offline: its unit is down. |
| Host | Memory in use is above the warning threshold; memory would exceed 100 % if every VM used its whole allocation; or the disk is above the host's warning threshold. | Memory in use is above the critical threshold, or the disk is above the host's danger threshold. |
A unit is down when systemd reports it neither active, reloading nor activating: a unit that reloads its configuration or is starting counts as up.
A route that leads to a stopped Development or Demonstration guest is counted, not flagged: a developer stops a VM they do not use. The qualifier is read as Muppy processes it: the stock Demo qualifier is processed as Staging, so its stopped guests are flagged.
A guest with no address in Muppy is not compared with LXD.
A PostgreSQL cluster or a Traefik server of the host that the snapshot does not measure — an archived or pending cluster, a cluster without a numeric port, a second Traefik server — shows as Unknown when App Servers use it, with the reason it is not measured.
A block that runs on another host — a PostgreSQL cluster or a Traefik server that the host's App Servers use — shows its status only. The status comes from the snapshot of its own host when that snapshot is not outdated, otherwise from Muppy (the cluster's health check, the state of the Traefik unit), otherwise it is Unknown. Its figures belong to its own host.
An outdated snapshot is older than Outdated after (see the settings below). Its figures may no longer be true, so opening the dashboard takes a new one.
How each figure is measured
The shell tools mislead on an LXD host: free and btop count the memory of a VM as cache, and
lxc list counts the file cache in the memory of an LXC. The dashboard measures each block
from its own control group:
- Host memory: in use = total − available; cache = available − free.
- LXC memory: in use = the anonymous and the shared memory of its control group (tmpfs, the
shared_buffersof a PostgreSQL inside it); cache = its file cache minus that shared memory. - VM memory: in use = what its LXD agent reports inside the VM; cache = the resident memory of its QEMU process minus that. The host's gauges count the whole resident memory.
- PostgreSQL memory: anonymous plus shared memory; its cache is its file cache.
- Projected memory: memory in use, with each VM, running or stopped, counted at its whole allocation.
- CPU: cores busy over the ten-second sample.
- Disk: the root file system of an LXC, measured with
du; the allocated and provisioned size of a VM's disk image. - System & other: what the host measures minus the sum of the blocks.
When the guests' disks hold more than / uses, the LXD storage pool lives on another device:
the dashboard says so and shows no projected disk for the host.
Settings
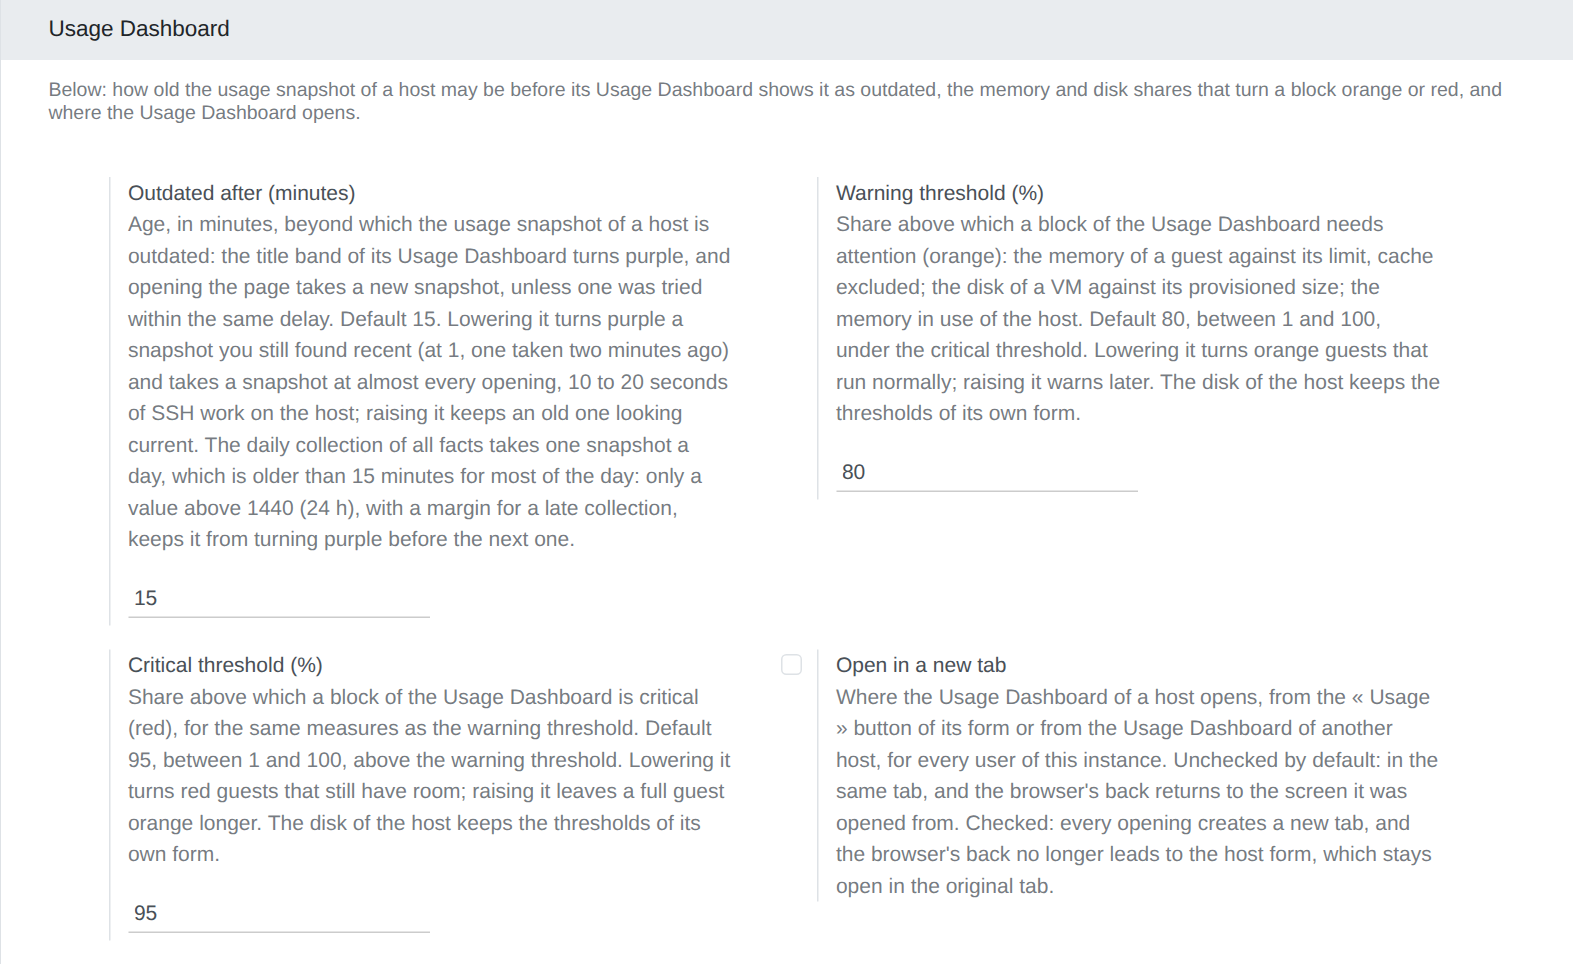
Four settings tune the dashboard, in Settings ▸ Muppy LXD ▸ Usage Dashboard:
| Setting | Default | What it does |
|---|---|---|
| Outdated after (minutes) | 15 | Age beyond which a snapshot is outdated. Opening the dashboard on an outdated snapshot takes a new one: a lower value means a snapshot at almost every opening. |
| Warning threshold (%) | 80 | Share of a guest's memory, a VM disk or the host's memory in use above which a block needs attention. |
| Critical threshold (%) | 95 | The same share, above which a block is critical. |
| Open in a new tab | unchecked | Opens the dashboard in a new tab, from the Usage button and from the link to another host's dashboard. The browser's back button then no longer leads to the Host form, which stays open in the first tab. |
The disk of the host keeps the Usage warning threshold and Usage danger threshold of its own Host form.