Monitoring
Three things to watch: the RCS's HA status, the pglookout daemons, and the HA Events Log.
HA status
An HA Active icon with a spinner means High Availability is running on the RCS.
When it is not:

Inspecting the daemons
The High Availability tab lists the pglookout daemons.
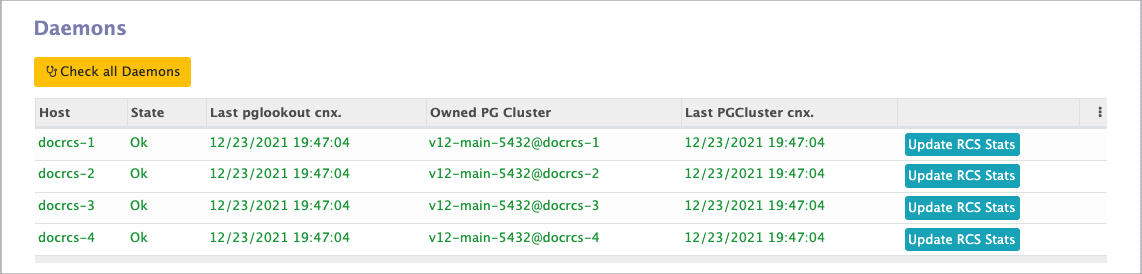
See pglookout Heartbeat for what the State and connection columns mean.
Click a line to open the daemon.
pglookout and mpypgd
The daemon deployed today is pglookout. It may eventually be replaced by mpypgd, an evolution of it — which is why you will see that name in field help and log entries.
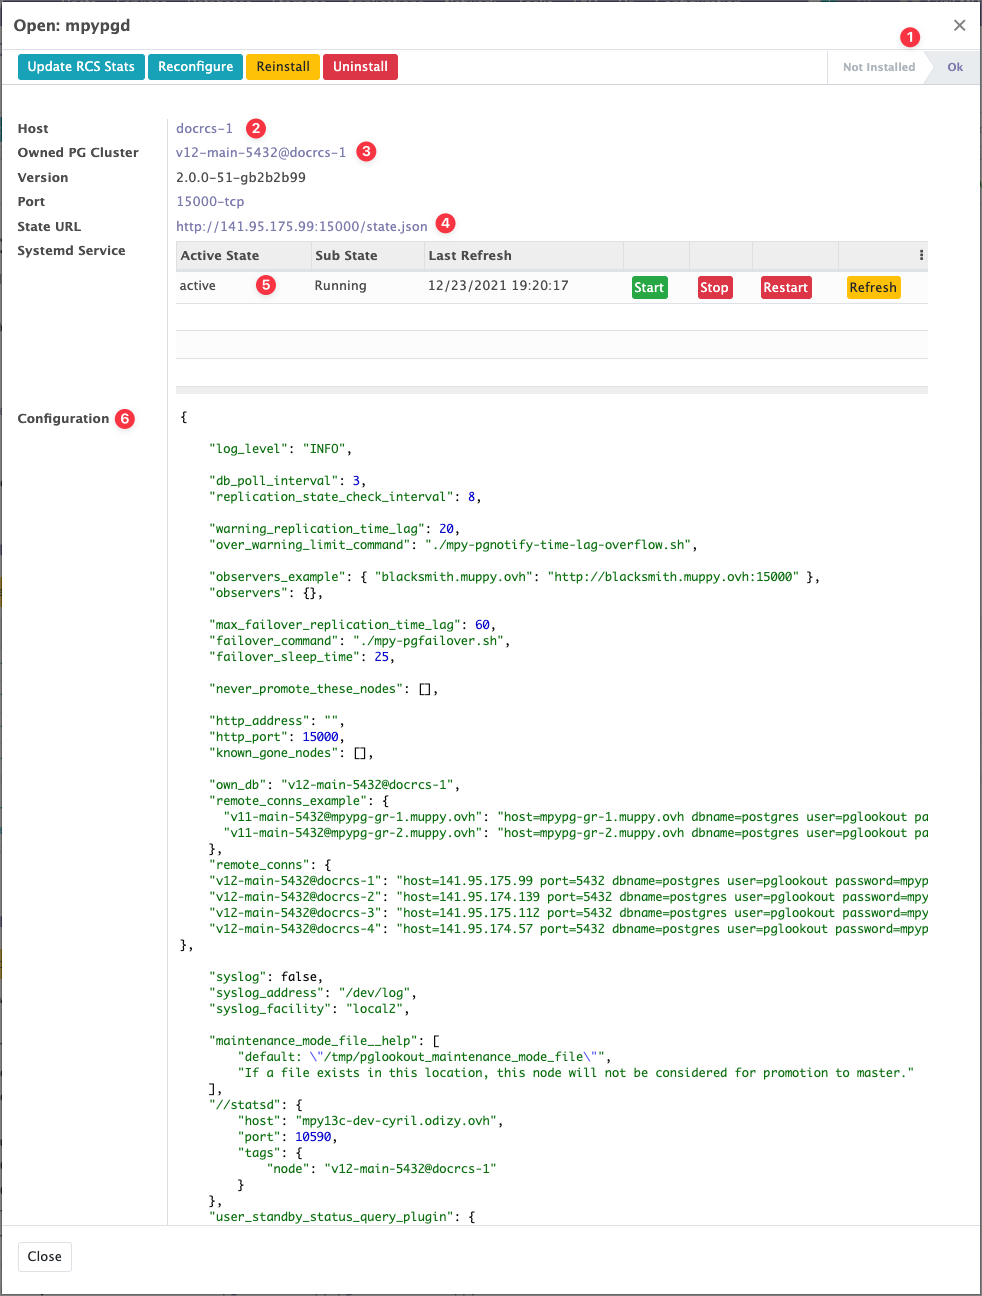
The form shows:
| Field | Meaning |
|---|---|
| State | Daemon status — Ok, or not installed. |
| Host | The Host the daemon runs on. |
| Owned PG Cluster | The cluster this daemon is responsible for. Leave it empty to create an observer — a node that owns no cluster and exists only to feed the consensus with replication statistics seen from another point on the network. |
| State URL | The daemon runs a small HTTP server publishing its statistics as JSON. Click the URL to open them. |
| Systemd Service | Muppy deploys the daemon as a systemd service. Opens the Muppy Systemd Service Unit that configures and controls it. |
| Configuration | The daemon's configuration. |
Header buttons:
| Button | Effect |
|---|---|
| Update RCS Stats | Fetch replication statistics from the State URL and use them to update the RCS's replication statistics. |
| Reconfigure | Recompute the configuration and push it to the daemon. |
| Reinstall | Reinstall the daemon from scratch. |
| Uninstall | Uninstall the daemon and reconfigure all the others — every daemon connects to every cluster, so removing one changes the others' configuration. |
HA Events Log
Most HA events are recorded in the HA Events Log, opened from the button of that name in the RCS header.
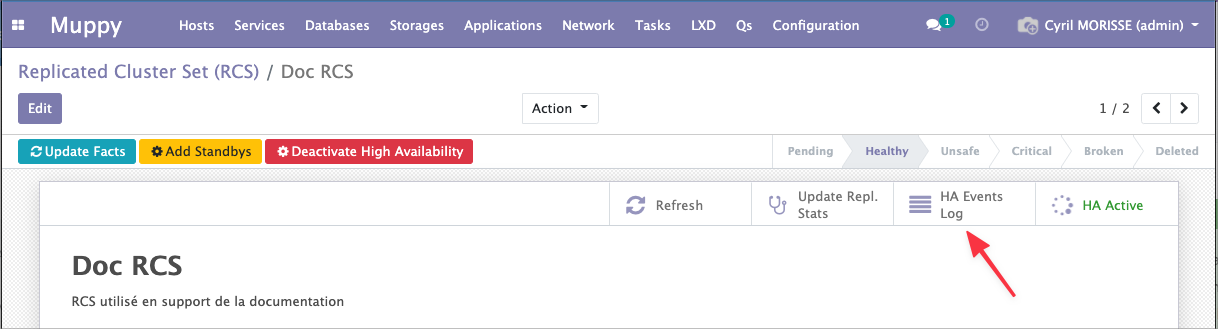
Use it to reconstruct the timeline of a failover after the fact.
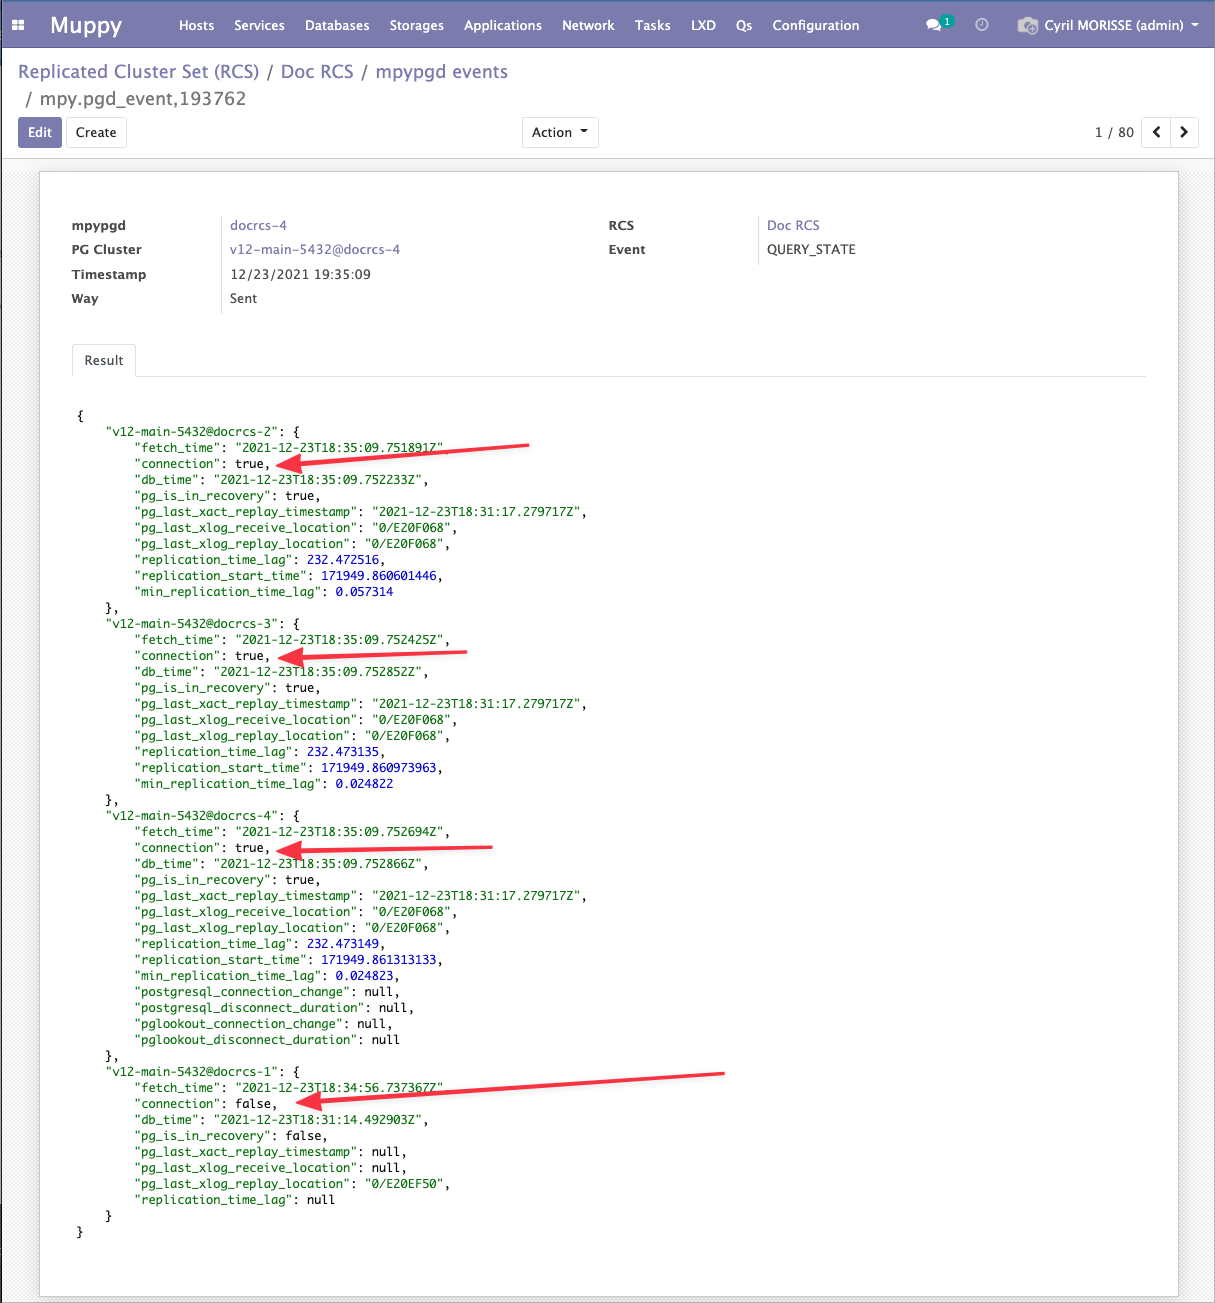
QUERY_STATE events carry the replication statistics as they stood at that moment. In the example below the primary has stopped answering, and you can read off which standby had the smallest lag.
Purging the log
Every 6 hours, Muppy deletes HA events older than 740 hours (about 31 days).
The scheduled action is Muppy: Purge PostgreSQL HA Event History, under Settings / Technical / Automation / Scheduled Actions.
With Muppy Enterprise you can change both the retention period and the purge frequency from that scheduled action's form:
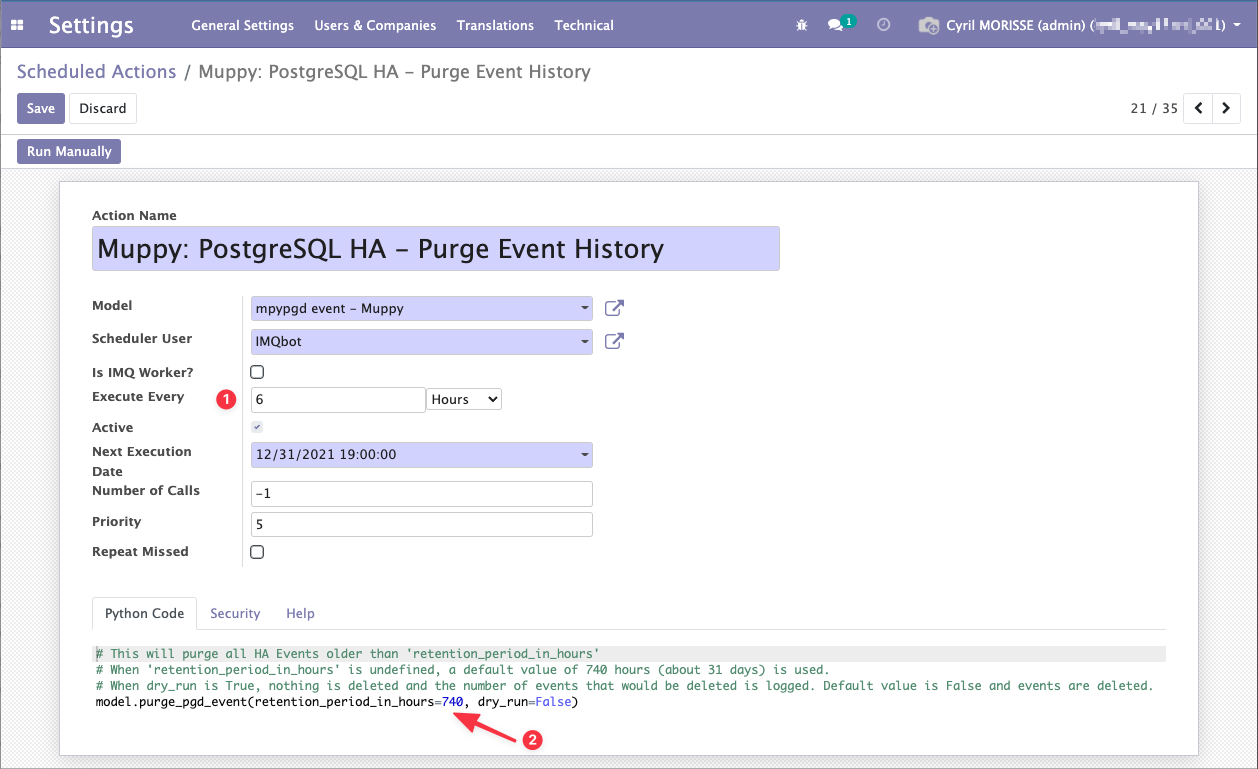
- The purge frequency.
- The retention period — the
retention_period_in_hoursargument in the action's code.
Save, and the change applies at the Next Execution Date. Use Run Manually to purge straight away.